
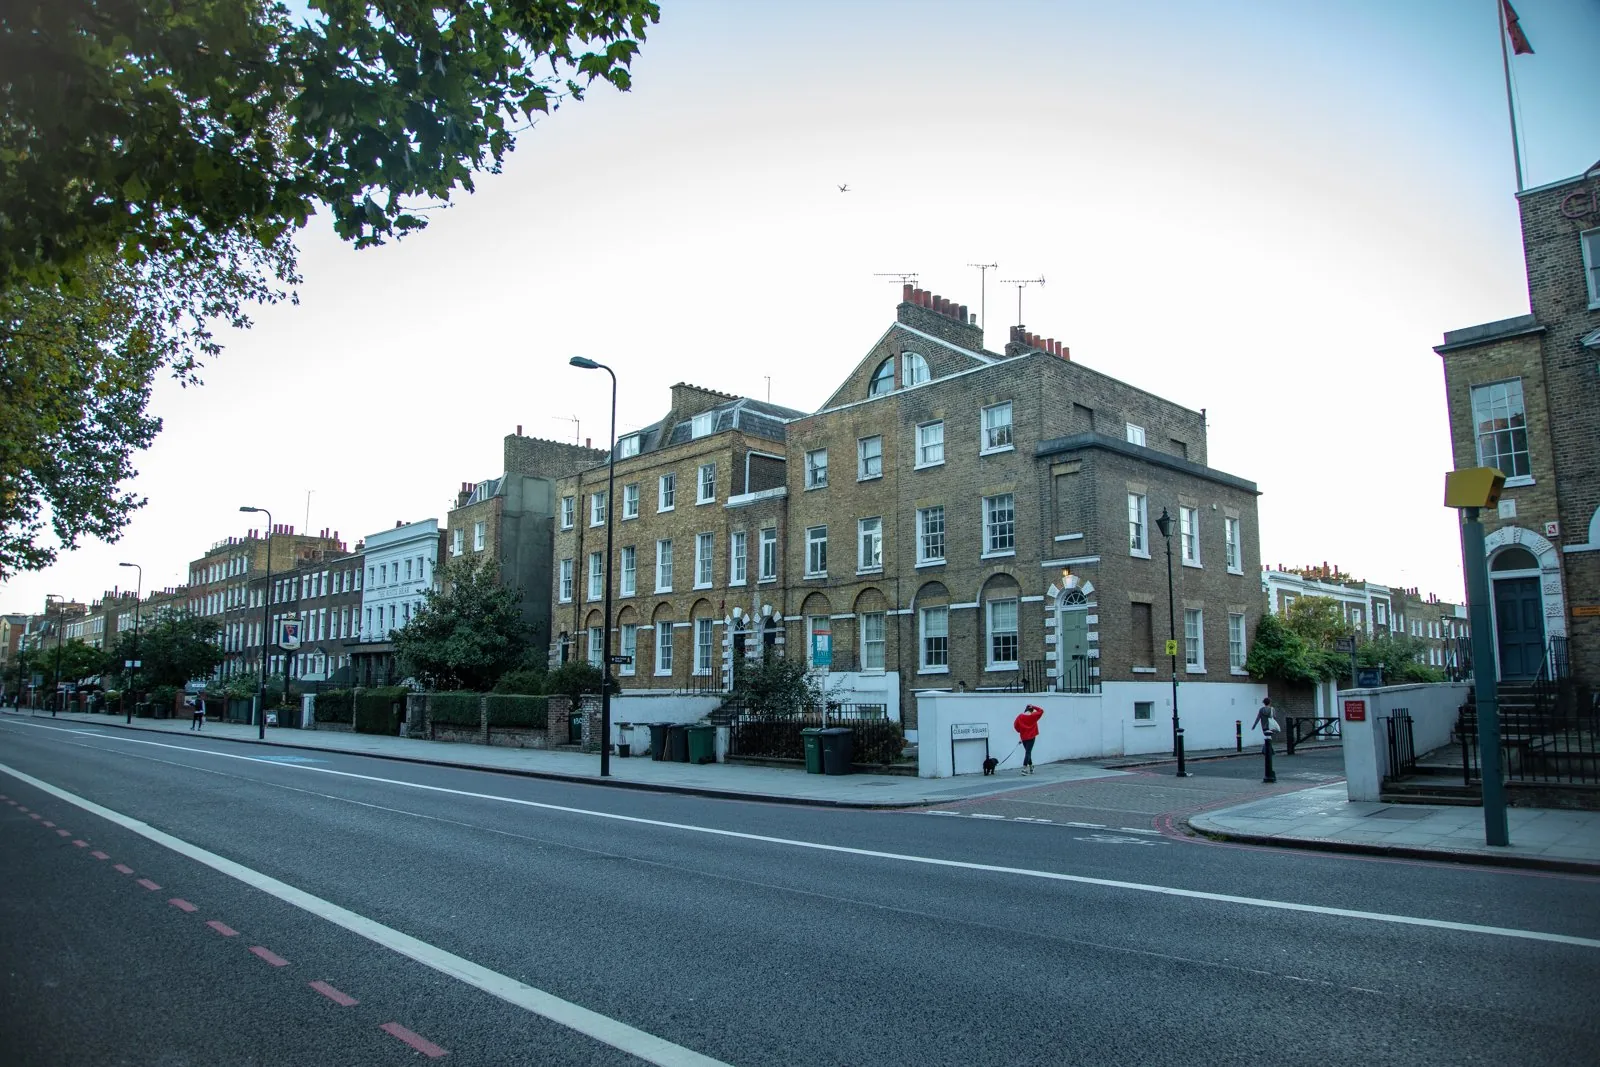
Kennington Park Road in Lambeth is lined with tall brick terraced houses, black railings and small front gardens, and it lies in Inner London, the part of the capital where official house prices have fallen furthest over the past year. The UK House Price Index (HPI), published on 18 November 2026 by HM Land Registry and the Office for National Statistics (ONS), puts the average Inner London home at £621,491 in September 2026, 7.2% less than a year earlier. The ONS and HM Land Registry both describe that as the largest annual fall for Inner London since August 2009, when the figure was minus 8.9%. Outer London prices were 0.1% lower than a year earlier, and the average Outer London home cost £509,382. By our reading of HM Land Registry's downloadable HPI data, the gap between the two averages was £112,109, down from £159,586 in September 2025.
The same official figures put the average London home at £545,579, down 1.4% on the month and 3.5% on the year. The national rent and house price numbers from this release are in UK rents rise 3.8% in the year to October 2026 as Inner London house prices post their biggest annual fall since 2009.
The ONS singles out flats as a contributor to London's fall. It says London flat prices fell 6.3% in the 12 months to September, the 14th consecutive month of annual falls, and notes that flats are around half of all property sales in London, against around one-fifth across Great Britain. The HPI data show the fall was steeper for Inner London flats than for those in Outer London.
| Area | Average price, September 2026 | Change over 12 months | Average flat price, September 2026 | Flat price change over 12 months |
|---|---|---|---|---|
| London | £545,579 | -3.5% | £420,985 | -6.3% |
| Inner London | £621,491 | -7.2% | £519,519 | -8.5% |
| Outer London | £509,382 | -0.1% | £332,656 | -2.3% |
Table compiled by Realtopedia from HM Land Registry's UK House Price Index: data downloads September 2026. Figures are provisional.
Houses held up better across London as a whole. The average terraced house cost £637,130, 1.2% less than a year earlier, while semi-detached prices rose 0.5% to £717,223 and detached prices were unchanged at £1,152,601.
Renting moved the other way. The ONS says the average private rent in London was £2,350 a month in October 2026, the highest of any English region, and its regional chart data show London rents up 3.8% over 12 months, the same annual rate as the UK as a whole. Kensington and Chelsea had the highest average rent of any local area in the UK, at £3,765 a month.
Because the HPI is compiled from sales once they are registered with HM Land Registry and its counterparts in Scotland and Northern Ireland, it trails measures based on the prices sellers advertise. Rightmove's asking-price figures for London are covered in London asking prices fall 1.8% in November 2026 and stay 1.0% below a year ago, Rightmove says.
The September numbers are a first estimate and may be revised. The ONS says HPI figures for the most recent 12 months remain open to revision, and that the September estimate is based on around 49% of all sales in Great Britain for the month. HM Land Registry will publish the October 2026 index on 16 December 2026.
The rules for foreign buyers in England and Northern Ireland set out who can buy a home there, and on what terms.
Sources
Sources read 20 November 2026.
- Private rent and house prices, UK: November 2026, Office for National Statistics statistical bulletin, released 18 November 2026, sections 1 to 3 and 5, with the Figure 5 chart data.
- UK House Price Index Summary: September 2026, HM Land Registry on GOV.UK, published 18 November 2026, sections 1 to 4.
- UK House Price Index: data downloads September 2026, HM Land Registry on GOV.UK, full UK HPI data file for September 2026, London, Inner London and Outer London series.