
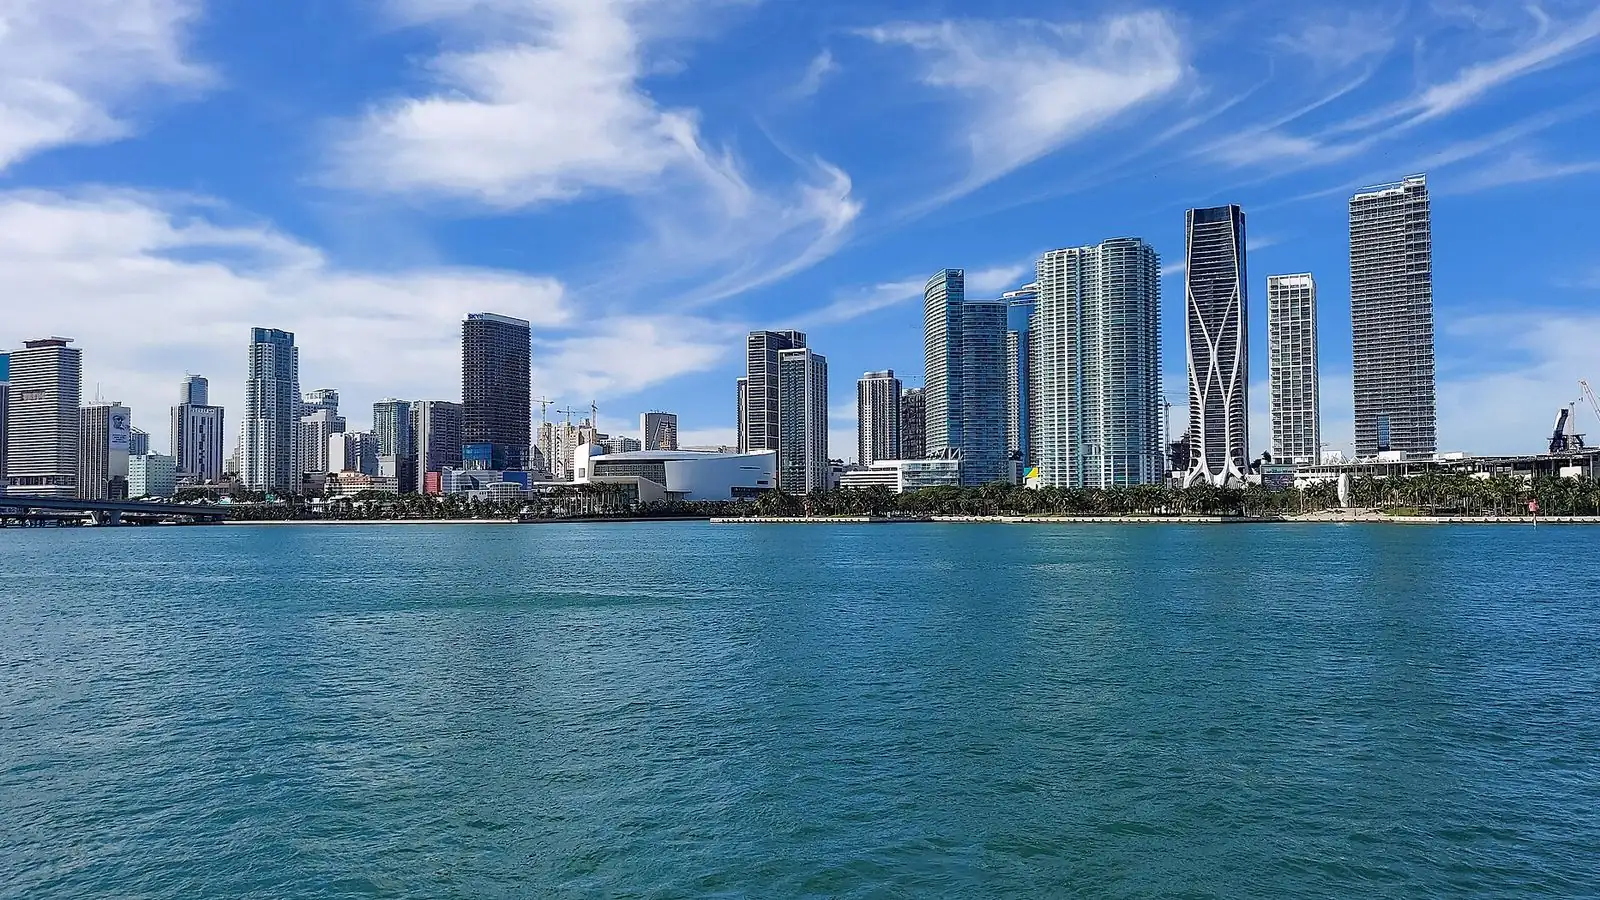
Along Biscayne Bay, the condominium towers of Downtown Miami and Brickell make up much of the county's skyline. The latest quarterly figures from Miami Realtors, which now publishes as MIAMI REALTORS® + RWorld, show that more condos and townhouses changed hands across the county over the summer, at almost the same median price as a year before.
The association released its quarterly market summary for Miami-Dade County on 16 October 2026. The report groups townhouses and condominiums together and counts sales that closed in July, August and September. It is produced by Florida Realtors from the data that brokers record on Florida's multiple listing services, so the prices are agreed sale prices rather than asking prices. In its news release of the same day, the association notes that its sales totals leave out new construction, pre-construction and condo conversion sales, because those are largely not reported in the multiple listing service.
Closed sales of condos and townhouses in Miami-Dade reached 2,846 in the third quarter, up 4.3% from 2,728 a year earlier. Buyers paying entirely in cash accounted for 1,396 of those sales, 7.1% more than in the third quarter of 2025.
The median sale price was US$409,500, down 0.1% from US$410,000, which leaves it effectively unchanged. The average sale price fell 5.4% to US$735,542 from US$777,326. The report treats the median as its main price measure because, unlike the average, it is not pulled around by a small number of very expensive sales.
Sellers accepted slightly smaller reductions from their original asking price than a year earlier. The median sale closed at 93.6% of the original list price, compared with 92.7% in the third quarter of 2025. Homes took slightly longer to find a buyer, with a median of 76 days between listing and contract, up from 72 days.
Fewer homes were for sale. Sellers put 5,767 condos and townhouses on the market during the quarter, 2.0% fewer than a year earlier. At the end of September there were 11,706 active listings, down 7.2% from 12,620. That equals 12.3 months of supply, down from 14.0 months. The report defines months of supply as an estimate of how long the current listings would take to sell at the average monthly sales rate of the past 12 months.
| Miami-Dade condos and townhouses | Q3 2026 | Q3 2025 | Change, year on year |
|---|---|---|---|
| Closed sales | 2,846 | 2,728 | +4.3% |
| Cash sales | 1,396 | 1,304 | +7.1% |
| Median sale price | US$409,500 | US$410,000 | -0.1% |
| Average sale price | US$735,542 | US$777,326 | -5.4% |
| New listings | 5,767 | 5,886 | -2.0% |
| Active listings at quarter end | 11,706 | 12,620 | -7.2% |
| Months of supply | 12.3 | 14.0 | -12.1% |
These are county-wide figures. Asking prices and listing conditions in individual neighbourhoods, from Coconut Grove to Downtown, are covered in Miami condos by neighbourhood in September 2026, from Coconut Grove to Downtown.
Sources
Sources read 19 October 2026.
- Quarterly Market Summary - Q3 2026, MIAMI REALTORS® + RWorld, Miami-Dade County townhouses and condos, produced by Florida Realtors, data released 16 October 2026.
- Quarterly Market Detail - Q3 2026, MIAMI REALTORS® + RWorld, Miami-Dade County townhouses and condos, definitions and economists' notes.
- South Florida Market Stats - Q3 2026 - MIAMI REALTORS® + RWorld
- Miami-Dade Breaks Annual Record for $30 Million-Plus Home Sales in Just Nine Months - MIAMI REALTORS® + RWorld, 16 October 2026.