
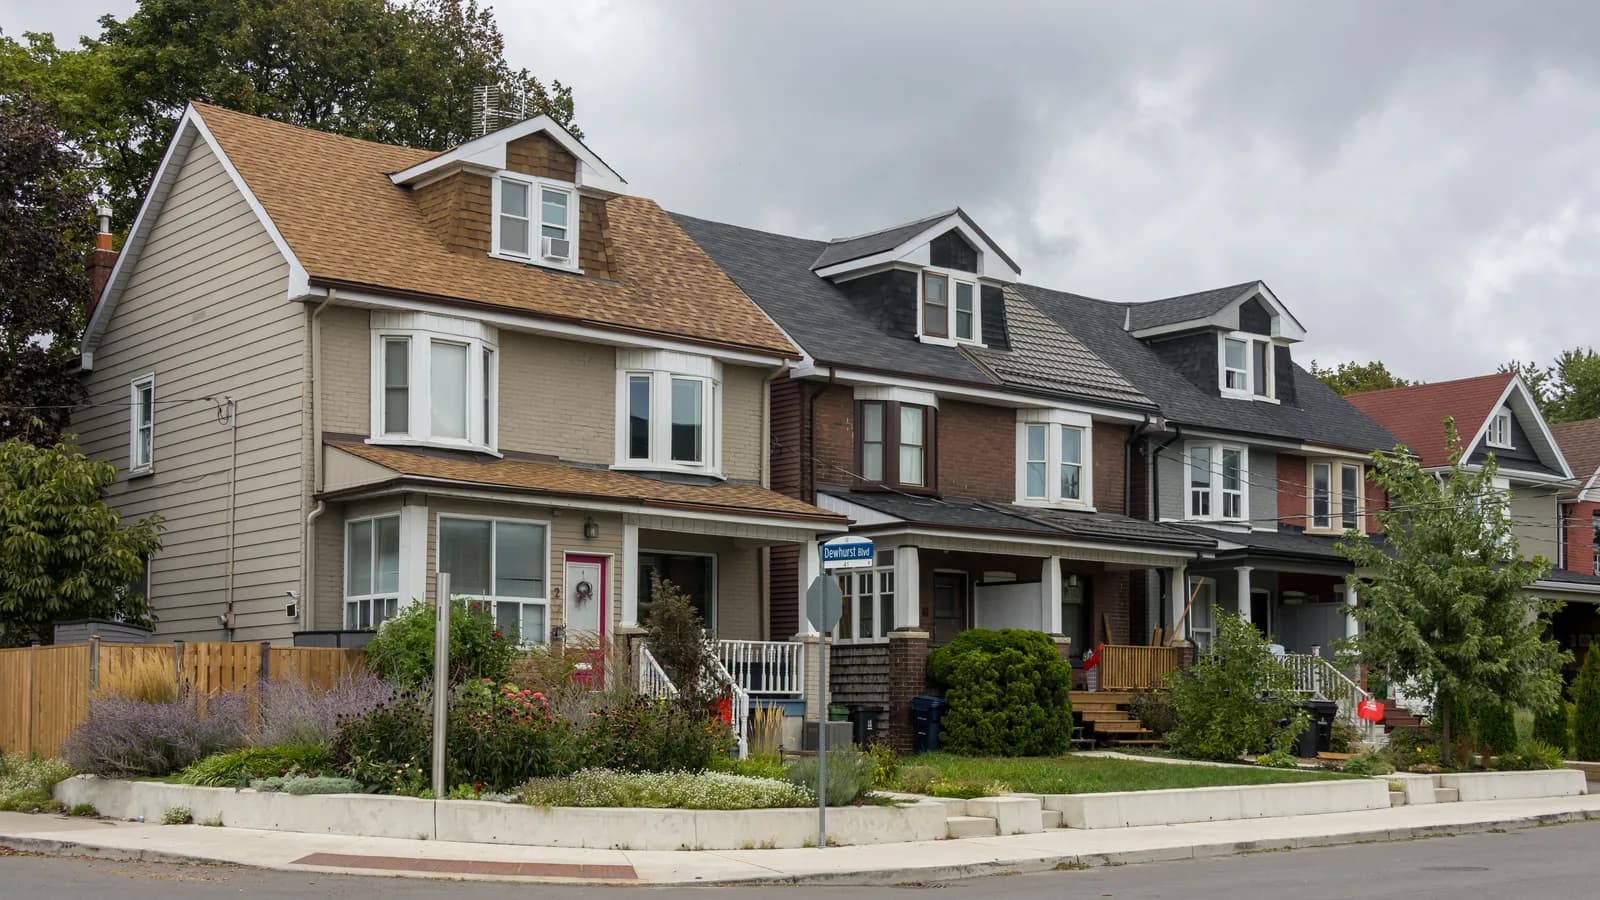
The Toronto Regional Real Estate Board (TRREB) released its October 2026 Market Watch on 4 November. Sales recorded through its MLS system across the Greater Toronto Area totalled 5,603, down 7.9% from 6,083 in October 2025. New listings fell 11.9% to 14,173. Active listings at month-end numbered 25,098, down 10.0% year over year.
TRREB's market area is wider than the City of Toronto. It covers Toronto, the regions of Halton, Peel, York and Durham, Orangeville in Dufferin County, and five municipalities in south Simcoe County. Unless a figure is labelled as the City of Toronto alone, it refers to that whole area.
The average selling price was C$1,024,108, down 2.7% from C$1,052,539 a year earlier. The MLS Home Price Index Composite benchmark was down 4.3% year over year. A benchmark tracks a typical home with a fixed set of features, so it is less sensitive to the mix of what sold that month than a simple average. On a seasonally adjusted basis, TRREB says sales, new listings, the HPI Composite and the average price all edged up from September.
TRREB's release points to uncertainty around inflation, borrowing costs and the economy as reasons buyers stayed cautious. Monthly mortgage payments for an average-priced home had edged up on a year earlier, the board said, but remained below the levels required in 2023 and 2024. For a buyer financing in Canadian dollars, those board figures sit alongside the Bank of Canada's overnight-rate path, covered in Bank of Canada raises the overnight rate 25 basis points to 2.5%. September's TRREB print is in Toronto-area home sales fell 9% in September 2026, TRREB figures show.
| TRREB market area | October 2026 | October 2025 | Change |
|---|---|---|---|
| Sales | 5,603 | 6,083 | -7.9% |
| New listings | 14,173 | 16,080 | -11.9% |
| Active listings | 25,098 | 27,899 | -10.0% |
| Average selling price | C$1,024,108 | C$1,052,539 | -2.7% |
| MLS HPI Composite (y/y) | — | — | -4.3% |
Sources
Sources read 6 November 2026.
- Toronto Regional Real Estate Board, Inflation and Borrowing Costs Impacted October GTA Real Estate Market, news release, 4 November 2026, read 6 November 2026
- Toronto Regional Real Estate Board, Market Watch October 2026, mw2610 PDF, read 6 November 2026