Prime and trophy
London prime this autumn
How to read a rise in sale value when the number of homes sold barely moves

- Prime and trophy
- Prices and market data
- London, United Kingdom
- Market report
- Data as of August 2026
- Industry data
- Also draws on press reports and official sources.
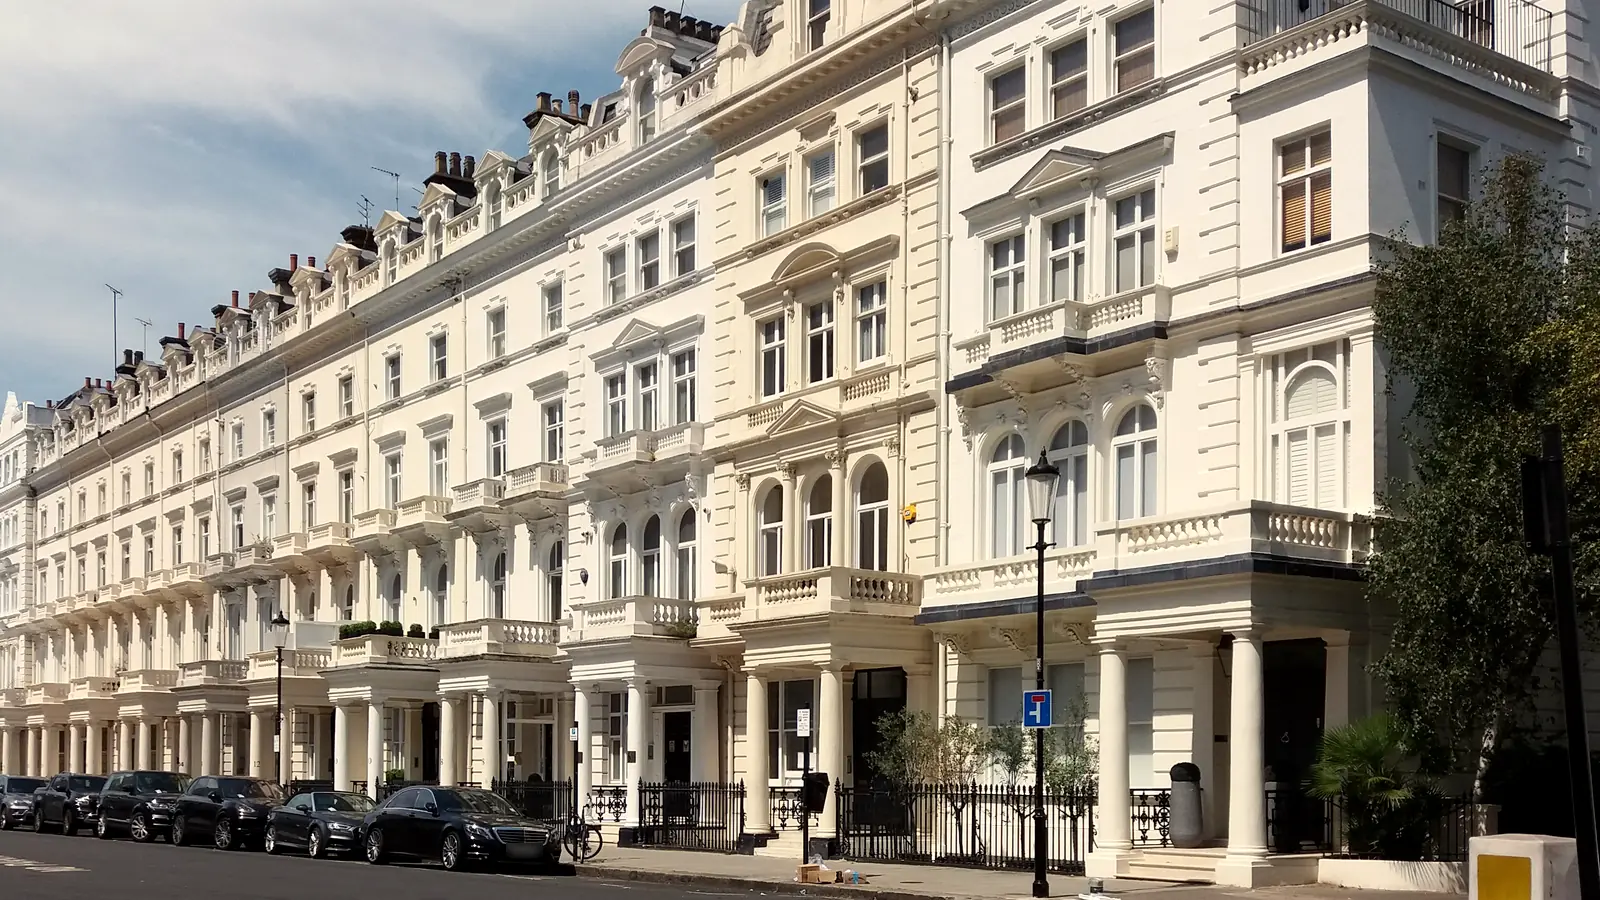
Two sets of figures on London's prime housing market appeared in September 2026 and seemed to point in opposite directions. The estate agency Knight Frank reported that the combined value of London home sales above US$10 million rose 72 percent in the second quarter. The next day, data from LonRes, reported by PrimeResi, showed prime London's quietest August for sales since 2008. Both rest on real data, but the figures come from different publishers, cover different slices of the market and measure different periods. A buyer weighing a flat in Kensington or a house in Belgravia needs to know which figure describes which homes before reading anything into either of them.
Who publishes these figures
Most of the figures below come from Knight Frank. As an estate agency that sells prime London homes, it has a commercial interest in how buyers read the market. Its figures are used here as data and nothing more. On 21 September 2026 Knight Frank published an article titled "Is now the right time to buy in prime central London?", in which its head of super-prime sales in London describes pricing as attractive, and the same page carries Knight Frank's own listings of London homes for sale. That framing is the agency's. It is not adopted here, and the reading in this piece rests on the numbers alone.
The second source is LonRes, a subscription data service used by London agents. LonRes builds its figures from sales and lettings data shared by the agents who use it, and it records a sale when contracts are exchanged. PrimeResi, a trade publication that covers the prime market, reported the LonRes figures for August on 17 September 2026 under a headline saying that prime London sales had hit an 18-year low.
Homes above US$10 million, quarter by quarter
Knight Frank's Global Super-Prime Intelligence series counts residential sales at US$10 million and above in twelve cities. Knight Frank revises the series from one edition to the next, so the same quarter can carry different figures depending on which edition is read. The London figures below all come from its latest edition, the data tables published with its note of 16 September 2026.
- Second quarter of 2025. 55 sales worth about US$1.04 billion.
- Third quarter of 2025. 36 sales worth about US$654 million.
- Fourth quarter of 2025. 38 sales worth about US$774 million.
- First quarter of 2026. 45 sales worth about US$836 million.
- Second quarter of 2026. 44 sales worth about US$1.43 billion, which Knight Frank ranks third of the twelve cities by value.
The second quarter of 2025 was first reported as 45 sales and now stands at 55, which changes the year-on-year reading further down. Earlier figures for these quarters are set out under About the figures, just above the sources.
The 72 percent rise in value and the dip to 44 sales that Knight Frank reported on 16 September 2026 are both quarter-on-quarter changes, measured against the first quarter of 2026. On the latest figures, the number of London sales fell by one between the two quarters, while combined value rose by nearly US$600 million.
The average sale in the second quarter was about US$32.6 million (roughly S$42 million at European Central Bank reference rates of 25 September 2026). Dividing the first-quarter value by the first-quarter count gives an average of about US$18.6 million. Knight Frank attributes the jump to "a flurry of remarkable sales at the upper end of the market rather than a broad-based rise in sales volumes."
Set against a year earlier, the count looks weaker. The latest edition records 55 London sales in the second quarter of 2025, so the 44 sales of the second quarter of 2026 were a fifth fewer, even though their combined value was about 37.5 percent higher (US$1.434 billion against US$1.043 billion). Against the 45 sales first reported for the second quarter of 2025, the fall would have looked like a single sale, which is why the edition matters. The same September edition counts 285 London sales at this level in 2022, 236 in 2024 and 163 in 2025. Read together, these numbers describe a smaller top tier, in which a few very large sales can move a quarterly value total a long way. They do not show more buyers at this level.
The tax background
In a report published on 4 February 2026, Knight Frank tied London's weakness at the top of the market to the government's tax changes, using the fourth-quarter figures it had at the time. London recorded 35 sales of US$10 million and above in the fourth quarter of 2025, which placed it seventh of the twelve cities, behind cities including Sydney and Miami. Knight Frank wrote that the most damaging parts of the reforms to the tax treatment of non-domiciled residents, known as non-doms, particularly those relating to inheritance tax, were prompting buyers to invest elsewhere. The same report noted that owners of London's most expensive homes were not selling in large numbers either.
The 35 sales and the seventh place are the figures as published in February 2026. Knight Frank's September 2026 edition restates London's fourth-quarter count as 38 sales worth about US$774 million. It does not publish a revised ranking for that quarter, so the seventh place is the February edition's ranking only.
The first two quarters of 2026 improved on that fourth-quarter count, on the first figure and on the revised one. They did not return London to the 55 sales that the latest edition records for the second quarter of 2025. The current tax rules themselves are not set out here, and anyone affected by them needs advice on their own position.
Prime central London over the summer, in two datasets
Knight Frank reported on 21 September 2026 that sales in prime central London in the three months to August were 6 percent higher than in the same three months of 2025. LonRes, in its dashboard for August 2026, counted 19.0 percent fewer sales across prime London than in August 2025, and 25.6 percent fewer than the average August between 2017 and 2019. It was the lowest number of sales in any August since 2008, which is the basis of the 18-year-low headline. The low is a comparison between Augusts. It is not the weakest month of any kind in 18 years.
Both figures can be accurate, because they do not measure the same thing. They differ in four ways.
- Area. LonRes defines prime London by postcode. Its prime central London group is SW1Y, SW1X, SW1W, SW1A, SW3, SW7, SW10, W1S, W1K, W1J and W8. Its August sales figure covers all prime London, which adds a prime inner group (among others NW3, NW8, W2 and W11) and a prime fringe group (among others SW6, SW11 and W4). Knight Frank's article refers to prime central London but does not publish the boundary it uses.
- Price threshold. LonRes's notes do not state a minimum price for its all-prime figures. It tracks homes at £5 million and above as a separate series, and in August those sales were 18.8 percent lower than a year earlier. Knight Frank's article does not state a price floor for its prime central London count. Its super-prime series, by contrast, starts at US$10 million.
- Period. LonRes compares a single month, August 2026, with August 2025. Knight Frank compares three months, June to August 2026, with the same three months of 2025. A weak August is compatible with a firmer three-month total if June and July were busier. LonRes's own summer report found prime London sales volumes from April to June 10 percent higher than a year earlier.
- What counts as a sale. LonRes records a sale at exchange of contracts. Knight Frank's article says only that its figure comes from Knight Frank data. It does not say whether a sale means an agreed offer, an exchange or a completion, or whether the count covers the whole market or only transactions Knight Frank handled.
The price and rent measures differ in the same way. Knight Frank puts average prices in prime central London about 23 percent below their last peak in mid-2015. LonRes, which measures achieved prices per square foot across all prime London, found them 7.0 percent lower in August than a year earlier and 6.7 percent below their 2017 to 2019 average. Knight Frank has prime central London rents up 1.1 percent in the year to July and about 37 percent above their level before the pandemic. LonRes has prime London rents up 3.8 percent in the year to August and 41.4 percent above their 2017 to 2019 average, with its prime fringe postcodes left out of the lettings figures.
On LonRes's count, the broad prime market was quieter in August than in any August since 2008. Knight Frank's three-month count points the other way for its own, unpublished definition of prime central London. LonRes's price measure was still falling in August, and Knight Frank's article gives no recent price change at all, only the distance from the 2015 peak. A long fall from a 2015 peak records where prices have been. It does not indicate where they go next, and it is not a measure of what a purchase will earn.
The homes behind the figures
Prime central London takes in Mayfair, Belgravia, Knightsbridge, Kensington and Chelsea. The housing ranges from white stucco terraces around private garden squares to red-brick mansion blocks and flats created inside converted period houses. St John's Wood and Notting Hill, both known for large family houses, are often discussed alongside these districts, but LonRes places their postcodes (NW8 and W11) in its prime inner group, not in prime central London. Whether a dataset includes them can change its totals.
Many flats in these districts are leasehold. A leaseholder owns the right to occupy the flat for a fixed number of years rather than owning it outright, and the remaining term shortens every year. The years left on the lease are therefore part of what is being bought, together with the service charge paid each year for the upkeep of the building. The plan, the quality of the materials and the daylight in a given flat are questions for the viewing and the survey. The market figures above answer a different question, which is what the wider segment has been doing.
Questions to settle before making an offer
- Which dataset describes this home? A W8 flat priced below £5 million falls inside LonRes's prime central London postcodes but below the threshold of Knight Frank's US$10 million series, so a quarterly average of US$32.6 million says nothing about its value.
- What have homes of the same type, tenure and size sold for recently on the same street or within the same block? Those completed sales are a closer guide than any citywide total.
- How many years remain on the lease, and how has the service charge moved over recent years?
- What will it cost in total to complete the purchase? That means the agreed price, stamp duty including any non-UK resident surcharge that applies to the buyer, legal and survey fees, and any refurbishment. Stamp duty for non-residents in England and Northern Ireland is covered, with dated official sources, in How to read a prime-price survey.
- Can the home be held comfortably if its value stays flat or falls for several years? On Knight Frank's figures, prime central London prices are still well below their 2015 level.
- How will the home be used? Living in it, keeping it as a second home occupied for a few weeks or months each year, and letting it to tenants carry different costs and risks. Rent can help to cover the cost of holding a flat, but a rent figure is not a return on the price paid, and neither is a price figure.
What the figures leave open
London's top tier had a strong quarter by value on a small number of very large sales, with fewer sales than a year earlier. The broader prime market had its quietest August for sales since 2008 on LonRes's count and a firmer summer on Knight Frank's. Prices remain below their 2015 level on Knight Frank's measure and were lower than a year earlier in August on LonRes's. None of this amounts to a recommendation to buy or to wait, and nothing here orders London streets from best to worst. Other city notes are listed under Cities and markets, and whether a non-resident may take title, let or borrow is recorded in the foreign-buyer rules guide. This is not legal, tax, or investment advice. Confirm with a qualified professional in the place.
About the figures
Earlier Knight Frank editions gave different numbers for some of the quarters listed above. The second quarter of 2025 was first reported in October 2025 as 45 sales worth about US$0.9 billion. The November 2025 edition raised that count to 52, and the February 2026 edition put the quarter at 55 sales worth about US$1.04 billion. The third quarter of 2025 was first reported in November 2025 as 36 sales worth US$669 million, shown as 37 sales worth US$710 million in February 2026, and is now back at 36 sales worth US$654 million. The fourth quarter of 2025 was first reported in February 2026 as 35 sales worth US$724 million. Knight Frank's July 2026 note, which put London's first-quarter count of 45 at 18 percent above the previous quarter, implied a revised fourth-quarter count of about 38 (45 divided by 1.18 is about 38.1) without printing it. The September 2026 edition now prints 38.
The first-quarter figures for London were first published on 3 July 2026 as 45 sales worth US$836 million, and the September edition leaves them unchanged, although it revises other cities and the twelve-city total for that quarter. Knight Frank's July note ranked London fourth by number of sales in the first quarter. The September edition does not publish a revised ranking for that quarter.
Sources
All sources read 28 September 2026 (Singapore time).
- Knight Frank (Liam Bailey), "Risers and fallers in the global super-prime reordering," 16 September 2026 (Global Super-Prime Intelligence, second quarter of 2026. London 44 sales, aggregate value up 72% to US$1.43 billion, third by value, average about US$32.6 million. Global first-quarter total revised.)
- Knight Frank (Liam Bailey), "Super-prime's centre of gravity shifts," 3 July 2026 (First quarter of 2026. London 45 sales, up 18% quarter on quarter, US$836 million, fourth by number of sales. The 18% implies a revised fourth quarter of 2025 of about 38.)
- Knight Frank (Liam Bailey), "London falls behind as global prime sales gather pace," 4 February 2026 (Fourth quarter of 2025 as published at the time. London 35 sales, seventh behind Sydney and Miami, US$724 million. Non-dom reforms and inheritance tax cited as the cause.)
- Knight Frank, Global Super-Prime Intelligence, 2026 Q2 edition (PDF), September 2026 (Latest edition, used for every London quarterly and annual figure in the list and comparisons. London counts and values from the second quarter of 2025 to the second quarter of 2026, annual counts from 2022 to 2025.)
- Knight Frank, Global Super-Prime Intelligence, 2025 Q4 edition (PDF), February 2026 (Fourth quarter of 2025 as first published, 35 sales and US$724 million. Second quarter of 2025 shown as 55 sales and US$1,044 million, third quarter as 37 sales and US$710 million.)
- Knight Frank, Global Super-Prime Intelligence, 2025 Q3 edition (PDF), November 2025 (Third quarter of 2025 as first published, 36 sales and US$669 million. Second quarter of 2025 shown as 52 sales.)
- Knight Frank, Global Super-Prime Intelligence, 2025 Q2 edition (PDF), October 2025 (Second quarter of 2025 as first published, 45 deals worth US$0.9 billion in the text and US$856 million in the table.)
- Knight Frank (Ellie Pryor), "Is now the right time to buy in prime central London?," 21 September 2026 (Prime central London sales up 6% in the three months to August against 2025. Average prices down 23% since the mid-2015 peak. Rents up 1.1% in the year to July and 37% above pre-pandemic levels.)
- LonRes, Prime London Market Dashboard, September 2026 edition covering August 2026 (PDF) (Prime London sales down 19.0% on August 2025 and 25.6% on the 2017 to 2019 August average, lowest August since 2008. £5 million-plus sales down 18.8%. Achieved prices per square foot down 7.0%. Rents up 3.8%. Postcode definitions.)
- LonRes, data coverage page (Sales recorded after exchange of contracts.)
- LonRes, "Prime London Market Update Summer 2026," 30 July 2026 (Data shared by London agents. Prime London sales volumes in the second quarter of 2026 up 10% on the second quarter of 2025.)
- PrimeResi, report on the LonRes August figures headlined as prime London sales hitting an 18-year low, 17 September 2026 (Members-only article. Headline and standfirst read.)
- European Central Bank, euro foreign exchange reference rates (Rates for 25 September 2026, crossed via the euro for the one currency conversion in the text.)